
Why liquidity and market depth matter more than “number go up”
If you trade tokens only by looking at price charts, you’re basically driving at night with headlights off. Liquidity and market depth show you how easily you can enter or exit a position without the price going crazy against you. Two tokens can have the same market cap and price, but behave completely differently in real trading: one lets you buy or sell thousands of dollars with almost no slippage, the other moves 5–10% on a modest order. In this guide we’ll unpack what liquidity really is, how to read order books and depth charts, what to check on major platforms like Binance, and how to avoid the classic beginner trap: getting stuck in an illiquid token you can’t exit at a fair price.
At a practical level, thinking about token liquidity is self-defense. You’re not just trying to guess the next pump; you’re making sure that, when it’s time to take profit or cut losses, the market can “absorb” your order. That’s where market depth comes in: how much real demand and supply exists around the current price. We’ll also walk through simple crypto liquidity analysis tools, real case studies, and a few low-friction crypto market depth trading strategies that don’t require PhD-level math.
—
Key terms, translated into plain language
Liquidity
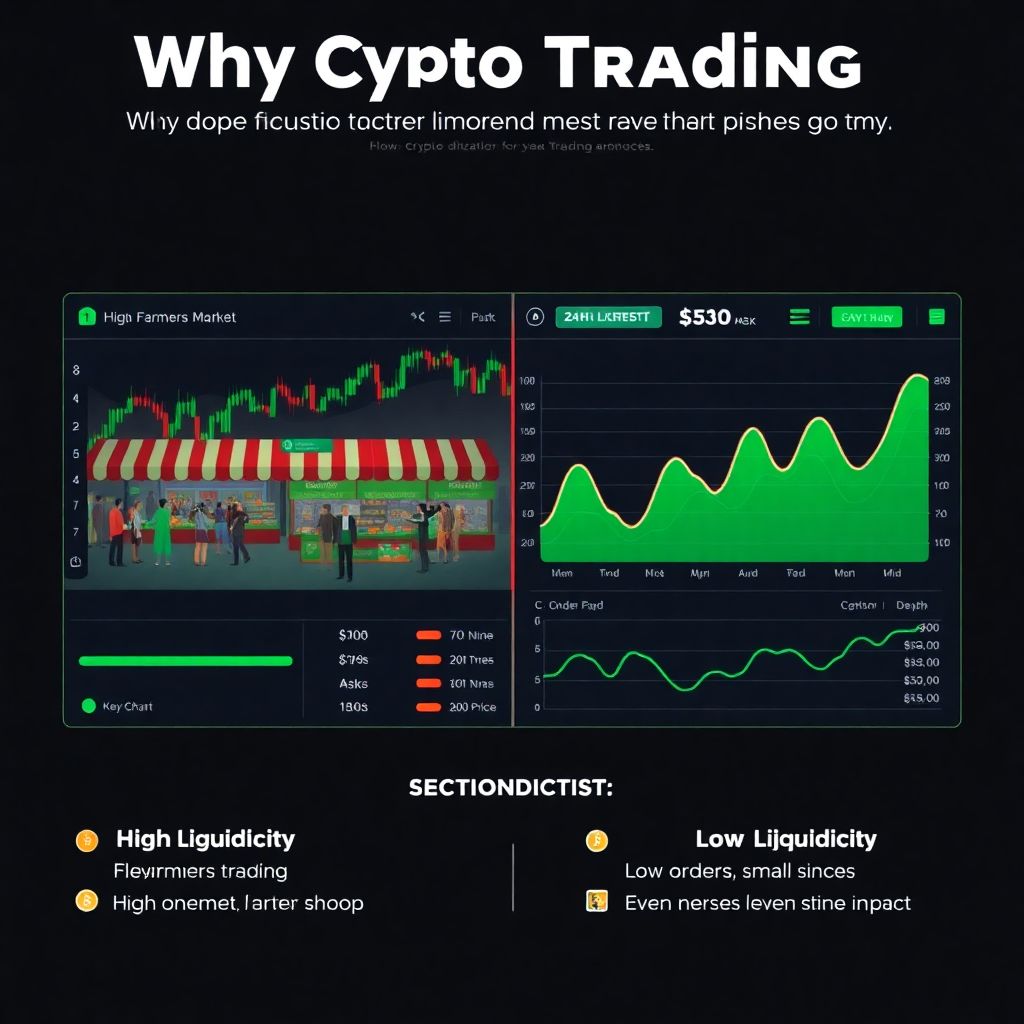
Liquidity is how easily and cheaply you can buy or sell a token without moving the price too much. High liquidity means big orders can be filled with small price impact; low liquidity means even modest orders cause large jumps. Technically, liquidity reflects the combined effect of trading volume, number of active buyers and sellers, and tightness of the bid-ask spread. For a beginner, the simplest rule: if you need to move more than a few hundred dollars and price changes more than 1–2% while you’re executing, the token is probably not liquid enough for serious trading, especially on smaller centralized or decentralized venues.
Another intuitive way to see liquidity: imagine a busy farmers’ market vs. an almost empty shop. At the market you can sell a bag of apples instantly at a fair price; in the empty shop you may wait, or accept a worse price. Tokens act the same. The best crypto exchanges for high liquidity feel like that busy market: constant two-sided flow, tiny spreads, deep order books. Lesser venues feel like the empty shop, where a single buyer or seller can push price around like a toy.
—
Market depth
Market depth shows not just the last traded price, but the “wall” of buy and sell orders sitting in the order book at different price levels. It answers the question: “If I try to buy or sell X dollars worth right now, how far will price move?” Depth is usually visualized with a depth chart. Imagine a simple diagram:
Buy side (green):
Price ↓ → |████████████ (lots of bids near market)
|██████ (fewer bids further away)
Sell side (red):
Price ↑ → |███████████████ (asks stacked tightly above price)
|██ (thin further away)
The “thickness” of those bars near the current price shows whether the market can absorb your order. A wide, smooth depth curve suggests stability; a jagged, thin one hints at volatility and slippage risk.
In practice, market depth is your x-ray of the order book. A token with high 24h volume but shallow depth may look alive, yet fail you the moment you push size through it. Genuine depth means tens or hundreds of thousands of dollars resting on both sides within a few ticks of the mid price, not just sporadic big orders far away that look impressive but don’t actually help real trades near spot.
—
Where liquidity really comes from
Order books, makers, takers and spreads
Most major spot exchanges use a central limit order book. Every limit order to buy sits in the book as a bid; every limit order to sell sits as an ask. Market makers (human or algorithmic) continuously quote both sides, while takers hit those quotes with market or aggressive limit orders. The spread is simply: best ask – best bid. A tiny spread (e.g. 0.01%) combined with constant updates is a sign of healthy competition between market makers and lots of natural flow. For retail traders, a narrow, stable spread usually means they can scale in and out without constantly wrestling with slippage or stalled orders.
When you look for the best crypto exchanges for high liquidity, you’re effectively looking for venues with lots of active makers and takers plus robust technology. That’s why the same token can feel completely different on two platforms: deep on one, dead on another. Centralized exchanges also sometimes have hidden internal liquidity from OTC desks or internalizers, which can further reduce visible spreads. But you should still focus on what you can see: book depth near the top, turnover, and the consistency of fills across different times of day.
—
On-chain vs centralized exchange liquidity
On DEXes, liquidity often comes from automated market makers (AMMs). Instead of an order book, you have a liquidity pool. Depth depends on how much capital LPs lock in those pools and on the curve logic (like constant product x*y=k). Centralized exchanges use discrete price levels; AMMs offer continuous pricing but can have steep slippage if the pool is small relative to your trade. As a beginner, it’s useful to compare the “feel” of the same token across both venues to understand true demand.
Here a mental diagram helps:
CEX:
Price levels: … 0.98 | 0.99 | 1.00 | 1.01 | 1.02
Orders: … 5k | 10k | — | 12k | 8k
DEX (AMM):
Pool: 100k token / 100k USDT
Curve: every extra buy slightly raises price; every sell lowers it
If you push a big order, the AMM price slides along the curve; on the CEX, you “eat” stacked orders level by level. Both concepts tie back to the same question: how much can you trade before price moves uncomfortably far?
—
How to check token liquidity on Binance (and other majors)
Step-by-step walkthrough on Binance
Let’s go through how to check token liquidity on Binance, since it’s often the first big venue people touch. Open the trading interface for the pair you care about, for example, BTC/USDT or some mid-cap alt. First, look at the 24h volume in the corner. As a rule of thumb, for most retail traders, daily volume above $10M is “seems okay,” above $100M is “liquid,” and in the billions is “institutional playground.” But volume alone is not enough. Next, scan the order book: expand it to show at least 20–50 price levels above and below. Check how much size sits within ±0.5% and ±1% of the last price; that’s your real, actionable depth.
Now watch the depth chart tab. On Binance it’s right next to the order book. You want a relatively symmetric “mountain” shape:
Green (bids) rising smoothly to the left of price.
Red (asks) rising smoothly to the right of price.
If you see big “cliffs” or voids close to the mid price, know that crossing those gaps can trigger sudden jumps and stop cascades. Finally, try a tiny test order using a market order—just a few dollars. If the execution price barely deviates from the displayed mid and fills instantly, it’s a good local sign. Repeat at different times of the day; some tokens are “awake” only during specific sessions, especially those with strong regional communities.
—
Cross-checking with external tools
Exchange UIs are convenient, but they’re not the only source of truth. Many traders use external crypto liquidity analysis tools to compare depth and spreads across venues in one dashboard. These services scrape order books from several exchanges and let you see, for example, that Token X has deep liquidity on Binance and OKX, but is basically a ghost market elsewhere. Some platforms approximate “true depth” at different slippage thresholds, like “how much can I buy before price moves 0.5%?” which is far more practical than volume alone.
If you’re doing active trading, it’s worth learning at least one token liquidity scanner for day trading. These scanners can surface pairs where spreads are tight, depth is sufficient, and intraday volatility is interesting enough to trade but not so wild that you get destroyed on every wick. This is how many day traders avoid wasting time on dead markets and instead rotate between pairs that actually let them enter and exit positions cleanly throughout the session.
—
Reading order books without hallucinating “whales”
Order book structure and simple diagrams
A classic beginner move is to open the order book, see one big order, and assume “a whale is buying” or “smart money is dumping.” Reality is messier. Orders can be layered, canceled, moved, or simply spoofed. Focus first on the aggregate structure rather than individual lines. Here’s a simplified order book picture:
Bids (buyers):
1.0000 – 5,000
0.9995 – 8,000
0.9990 – 12,000
Asks (sellers):
1.0005 – 4,000
1.0010 – 9,000
1.0015 – 15,000
If the cumulative size on bids within 0.5% is similar to that on asks, the market is roughly balanced. If bids vastly outweigh asks near price, short-term downside may be cushioned. If asks dominate, upside may be heavy. But remember: in volatile markets those orders can vanish. True depth is what remains through turbulence, not just what you see in a calm snapshot.
Short-term, watch how the book behaves when price approaches visible “walls.” Do they get eaten, pulled, or refreshed? Over time, you’ll sense which tokens have reliable liquidity and which are full of disappearing orders that exist only to scare or bait traders. That feel is an edge by itself, especially when you size positions relative to that reliability.
—
Comparing depth across exchanges
The same token might show a strong order book on one venue and be almost empty on another. That’s why traders often consider which are the best crypto exchanges for high liquidity for their specific trading style. For large spot trades, you might split an order across two or three deep venues to minimize footprint. For small-ticket swing trades, sticking to the single deepest exchange is usually enough.
A simple mental experiment: say Token Y has $200M 24h volume on Exchange A but only $5M on Exchange B. On A, the top 1% of the book holds $3M in bids and $3M in asks; on B, it’s just $50k each side. If you try to sell $30k in a hurry, Exchange A barely flinches; on B, you might blow through multiple levels and trigger stops. Same token, very different execution experience. This comparison mindset keeps you from blaming “random volatility” for something that’s really just thin local liquidity.
—
Case studies: when liquidity made or broke the trade
Case 1: The altcoin that looked great on the chart
Imagine Anna, a new trader, finds an altcoin with an impressive pump on a daily chart. She sees strong volume bars and assumes it’s liquid enough. She market-buys $5,000 worth on a smaller exchange where she already has funds. The displayed price is $1.00, but due to a thin order book, her real average fill price ends up at $1.06—a 6% slippage she doesn’t notice at first. Days later, when hype cools, she tries to exit. There are almost no bids; her $5,000 sell order starts at $0.95 and finishes around $0.88. Round trip, she loses over 10% purely from liquidity issues, even though the overall market barely moved.
If Anna had used even basic crypto liquidity analysis tools or checked the depth chart on a major venue, she would have noticed that the “volume” mostly came from one big day on a single exchange, and live depth was thin. A 30-second check of the order book and an estimated slippage for her order size would likely have kept her away—or at least made her size much smaller. That’s the point: liquidity checks don’t guarantee profit, but they help avoid dumb, totally preventable losses.
—
Case 2: Day trader picking pairs via a scanner
Now take Ben, an intraday trader who doesn’t care about long-term narratives. Each morning he runs a token liquidity scanner for day trading that ranks pairs by spread, depth within 0.3–0.5%, and realized volatility. He filters out anything with spreads larger than 0.1% or shallow near-book depth. From the remaining list he picks three or four pairs to focus on, often majors like BTC and ETH plus a couple of high-volume altcoins.
Because Ben builds his crypto market depth trading strategies on this kind of pre-filter, his winning trades aren’t better “ideas” than Anna’s. They simply occur in markets where his entries and exits behave predictably: stop-losses get hit close to the taped level, partial profit-taking doesn’t move price much, and he can scale out if momentum fades. Over hundreds of trades, the reduced friction from good liquidity is a massive edge. It doesn’t show in a single PnL screenshot, but it accumulates quietly as lower slippage and fewer “what just happened?” moments.
—
Simple liquidity-focused strategies for beginners
Position sizing by depth, not by gut feeling
One practical habit: base your maximum position size on visible depth. Before entering, ask, “If I had to exit this entire position with a market order right now, how far would price move?” Roughly estimate by summing the order book size on the opposite side within your acceptable slippage (say 0.5% or 1%). If your desired position is larger than that, either reduce size or split execution. This applies whether you’re on a big CEX or an AMM—on DEXes, use the trade preview to see estimated slippage for your intended size.
Over time, you’ll notice patterns: majors let you go bigger without much thought; mid-caps require conscious sizing; microcaps are better treated as lottery tickets with tiny, pre-defined risk. This discipline alone can prevent the classic beginner disaster: going “all in” on a low-liquidity token, then discovering the only way out is to nuke the price against yourself. Treat depth as part of your risk matrix, just like volatility or leverage.
—
Using depth in short-term trading decisions
For short-term trades, depth can serve as a context filter. Suppose price is approaching resistance, but you see a thick layer of bids just below current price and relatively thin asks above. Even without fancy indicators, that imbalance suggests dip buyers are aggressive while sellers are not fully committed. Conversely, a heavy block of asks right above you with fragile bids below can warn that upside breakouts might be harder than the chart alone suggests.
These aren’t magic signals; they’re hints about who’s more ready to commit size near current levels. Combine this with your usual toolkit—support/resistance, trend, maybe a couple of indicators—and you have a richer picture. The key is: don’t treat depth snapshots as prophecies. Watch how they evolve when price moves. Real buying or selling is reflected in orders that stay, get filled, and reappear—not just in walls that vanish the moment they’re touched.
—
Bringing it all together
Evaluating token liquidity and market depth isn’t an advanced skill reserved for quants; it’s basic hygiene for anyone trading more than lunch money. The workflow can be simple: pick a venue known for strong liquidity in your target pair, inspect 24h volume and spreads, read the order book and depth chart near the current price, cross-check with external crypto liquidity analysis tools if needed, and size your orders so that forced exits wouldn’t shove price dramatically. Practice this process on majors first, then extend it to more exotic tokens once you’re comfortable.
Over weeks and months, you’ll find that a lot of painful experiences—failed exits, weird wicks, slippage that eats half your edge—stem from ignoring liquidity, not from bad “ideas.” Once you start treating depth as a core part of your pre-trade checklist, you’ll stop feeling like the market is out to get you and start seeing it for what it is: a crowd of buyers and sellers with varying levels of commitment stacked at different prices. Your job is to navigate that crowd where it’s thick, not where it’s empty.