
Understanding Token Price Movements Through On-Chain Data
When token prices swing up or down, investors often scramble to make sense of the shift. Is it hype? A whale dumping? Or maybe a fundamental change in user behavior? While traditional market analysis relies on charts and news, crypto gives us something extra powerful — on-chain data. Let’s unpack how you can use this data to decode what’s really moving token prices.
What Is On-Chain Data, and Why Should You Care?

On-chain data refers to all the information recorded directly on a blockchain — wallet activity, transaction volumes, smart contract interactions, and more. Unlike centralized markets where insider info stays hidden, blockchains are transparent by design. That means you can spot trends before they hit the headlines — if you know what to look for.
Here’s why it matters:
- Real-time insight: You see what users are doing, not just what they’re saying.
- Behavioral patterns: Track whales, retail investors, and even bots.
- Unfiltered truth: No PR spin. Just raw data.
Key On-Chain Metrics That Influence Price Movements
Let’s dive into the most actionable on-chain metrics and how to interpret them in the context of token price changes.
1. Active Addresses
When the number of active addresses spikes, it usually signals growing interest or adoption. But context is everything. A sudden surge could mean:
- New users entering the ecosystem
- Airdrop farming or bots creating noise
- Short-term speculation
🧠 Expert tip: Cross-check active addresses with transaction volumes. If both are rising, it’s more likely real user activity — and that could support a sustainable price increase.
2. Transaction Volume
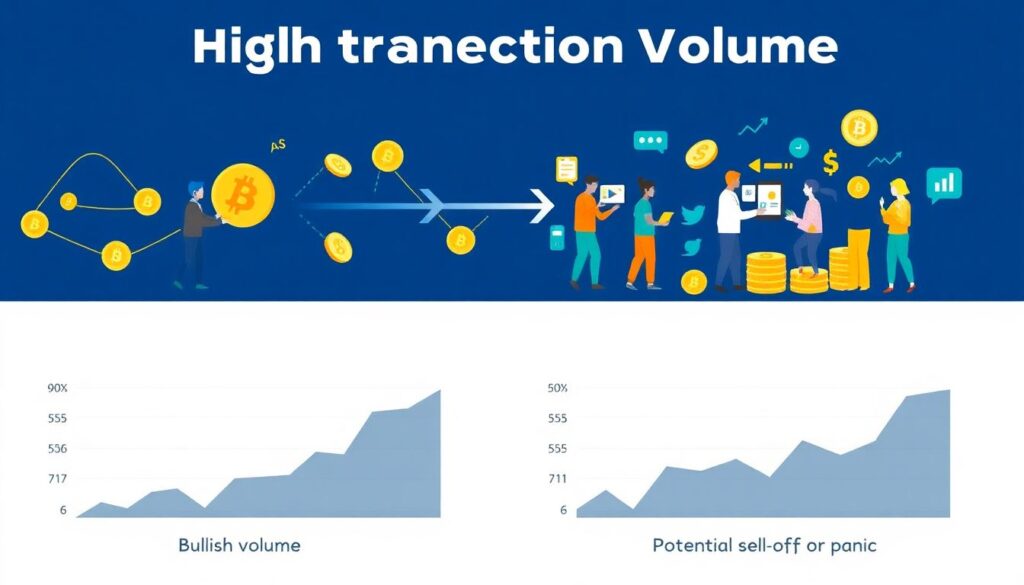
High transaction volume typically reflects strong network usage. But again, nuance matters. Are users just swapping tokens on DEXs, or are they interacting with dApps in meaningful ways?
- Increasing volume + rising price: Bullish signal
- Increasing volume + falling price: Potential sell-off or panic
🧠 Expert insight: Look at the volume in stablecoins too. A spike in USDT or USDC transfers to exchanges might signal incoming sell pressure.
3. Exchange Inflows and Outflows
This metric is a direct window into market sentiment. When tokens flow into exchanges, it often means holders are preparing to sell. Outflows suggest accumulation or long-term holding.
- High inflow: Possible dump incoming
- High outflow: Bullish accumulation
🧠 Pro tip: Monitor whale wallets. If large holders are moving tokens to exchanges, it’s time to pay attention — they often move the market.
4. Token Holder Distribution
The distribution of tokens among wallets tells you who holds power. If a few wallets control most of the supply, price movements can be sharp and unpredictable. A more even distribution suggests a healthier, more decentralized ecosystem.
- Concentrated supply: High risk of manipulation
- Diversified holders: More organic price trends
🧠 Analyst advice: Use tools like Nansen or Glassnode to track wallet clusters and identify early accumulation patterns.
Putting It All Together: A Practical Framework
On-chain data is most powerful when you combine multiple signals. Here’s a step-by-step approach to interpreting price action:
- Start with price movement: Identify significant changes (spikes or dips)
- Check exchange flows: Are tokens moving in or out?
- Analyze wallet activity: Are whales active? Are new wallets joining?
- Look at volume and address count: Are these metrics rising together?
If most signals align — for example, high outflows, rising active addresses, and increased volume — the price move is likely driven by fundamentals, not just hype.
Common Pitfalls to Avoid

Even seasoned analysts can misread the data. Here are a few traps to watch out for:
- Overreacting to short-term spikes: One whale move doesn’t equal a trend.
- Ignoring context: A rise in active addresses during an airdrop isn’t necessarily bullish.
- Relying on one metric: Always cross-reference multiple signals.
🧠 Veteran perspective: “On-chain data is a powerful lens, but it’s not a crystal ball. Use it to confirm narratives, not to chase pumps,” says Alex Krüger, macro crypto analyst.
Final Thoughts: From Data to Decisions
Interpreting token price movements through on-chain data isn’t about prediction — it’s about understanding. It gives you a behind-the-scenes view of what’s really happening in the market. When used wisely, it can help you separate signal from noise, avoid emotional decisions, and spot opportunities early.
So next time a token starts moving, don’t just check the chart — dig into the chain. That’s where the real story lives.